Using rotated lines
Mathematically speaking, snowflakes have two very important properties: they are symmetric and they are random. Let's try to harness those two properties to create 'realisitic' looking snowflakes.
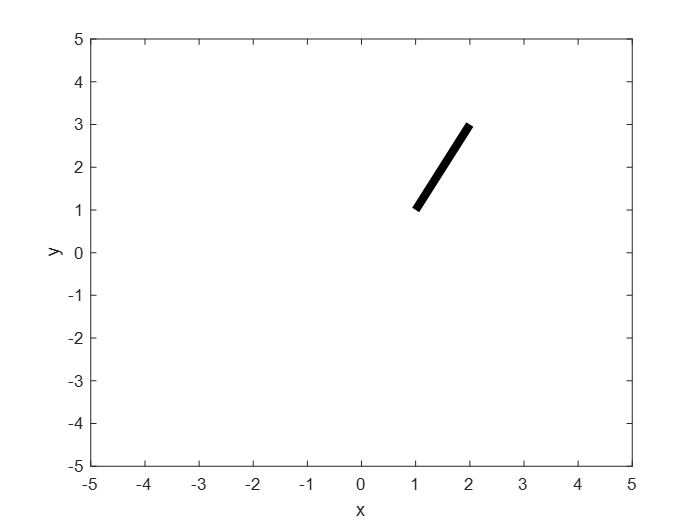
So how do we make a snowflake symmetric? The simplest way to make something rotationally symmetric is to rotate it! Let's just start with an arbitrary line, say from (1,1) to (2,2).
figure

plot([1,2],[1,3],'k-','LineWidth',5)

hold on

xlim([-5,5]);

ylim([-5,5]);

xlabel('x');

ylabel('y');
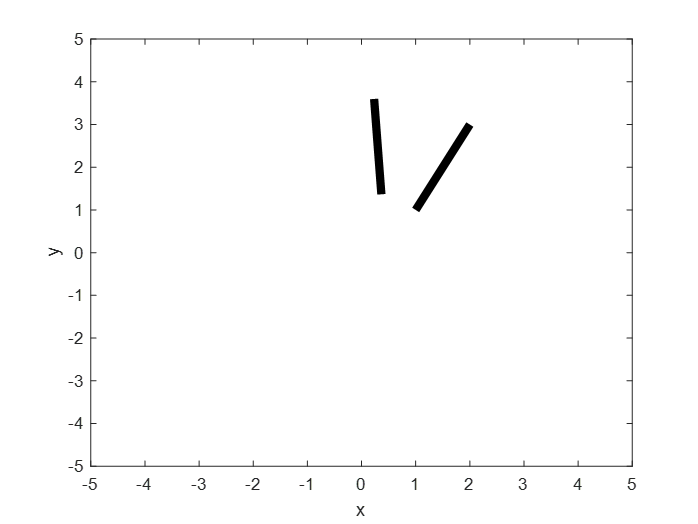
Now let's rotate that line about the origin every 30 degrees. How do we rotate a line about the origin? The answer is quite simple. First, you take the rotation matrix:

You replace theta with whatever angle you want to rotate by- in our case 30 degrees. Then you multiply the vectors representating the endpoints of your line by this rotation matrix to get the endpoints of your new, rotated line as follows:

figure

plot([1,2],[1,3],'k-','LineWidth',5)

hold on

xlim([-5,5]);

ylim([-5,5]);

xlabel('x');

ylabel('y');

pt1=[cosd(30) -sind(30);sind(30) cosd(30)]*[1;1];

pt2=[cosd(30) -sind(30);sind(30) cosd(30)]*[2;3];

plot([pt1(1),pt2(1)],[pt1(2),pt2(2)],'k-','LineWidth',5)
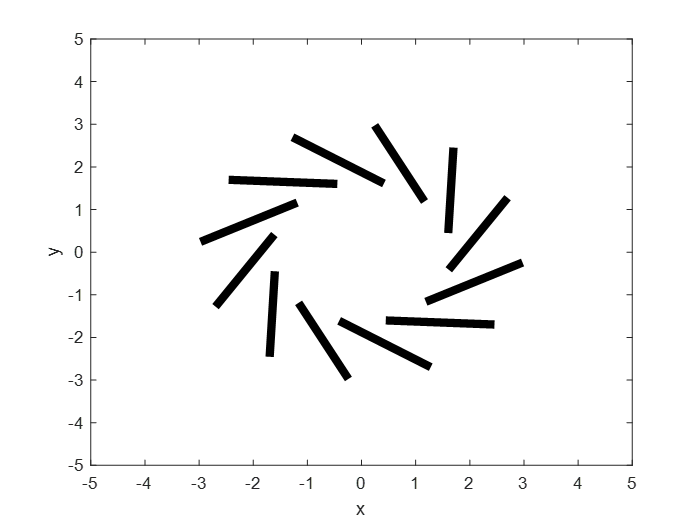
Now let's continue this pattern around the circle. To do so, we'll want to make our code more streamlined. So we introduce a for loop to draw our 'snowflake.'
figure

for ang=0:30:330

    pt1=[cosd(ang) -sind(ang);sind(ang) cosd(ang)]*[1;1];

    pt2=[cosd(ang) -sind(ang);sind(ang) cosd(ang)]*[2;3];

    plot([pt1(1),pt2(1)],[pt1(2),pt2(2)],'k-','LineWidth',5)

    hold on

    xlim([-5,5]);

    ylim([-5,5]);

    xlabel('x');

    ylabel('y');

end
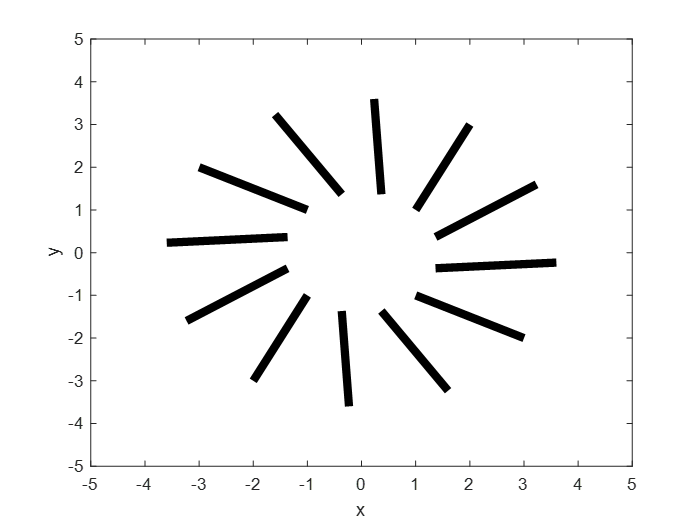
Alright, so we've successfully made a symmetric snowflake! But every time we run this code, we'll get the exact same snowflake! How can we add some variation?
The easiest way is to take advantage of Matlab's rand command, which generates a random number between 0 and 1. So to get a random number between zero and 2, you just say 2*rand, etc. We can use this to make the endpoints of our initial line random.
figure

orig1=[4*rand;4*rand];

orig2=[4*rand;4*rand];

for ang=0:30:330

    pt1=[cosd(ang) -sind(ang);sind(ang) cosd(ang)]*orig1;

    pt2=[cosd(ang) -sind(ang);sind(ang) cosd(ang)]*orig2;

    plot([pt1(1),pt2(1)],[pt1(2),pt2(2)],'k-','LineWidth',5)

    hold on

    xlim([-5,5]);

    ylim([-5,5]);

    xlabel('x');

    ylabel('y');

end
Okay, now let's try adding more lines!
figure

numlines=5;

orig1=zeros(2,2*numlines);

for i=1:2*numlines

    orig1(:,i)=[4*rand;4*rand];

end

for ang=0:30:330

    R=[cosd(ang) -sind(ang);sind(ang) cosd(ang)];

    for i=1:2:2*numlines-1

        pt1=R*orig1(:,i);

        pt2=R*orig1(:,i+1);

        plot([pt1(1),pt2(1)],[pt1(2),pt2(2)],'k-','LineWidth',5)

        hold on

    end

    xlim([-5,5]);

    ylim([-5,5]);

    xlabel('x');

    ylabel('y');

end
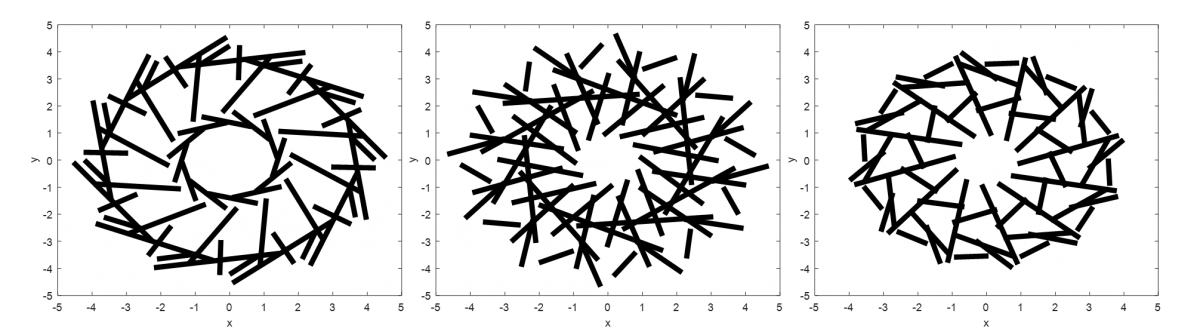
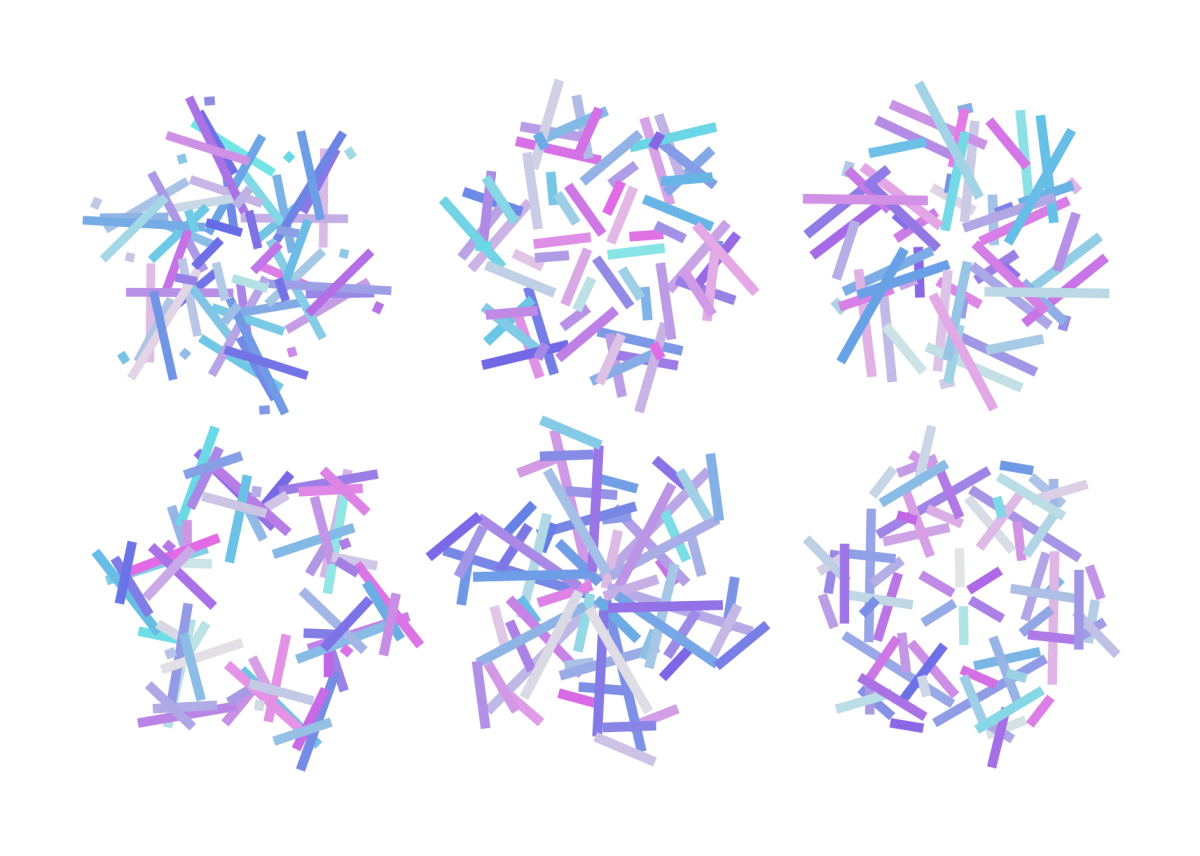
Here's the final, more polished code. Try running this- play around with setting the color, or the number of lines.
% Generate a 700x700 figure

fig1=figure('Position',[10,10,700,700]);

% Set up the plot parameters

plot(0,0)

radius=10000;

hold on

xlim([-radius*1.5,radius*1.5]);

ylim([-radius*1.5,radius*1.5]);

axis off
% This creates a matrix that will hold the line values for the snowflake

% The second dimension is a random number between 10 and 25-- twice the total number of lines in the snowflake

v1=zeros(2,round(rand*15+10));
% This loop fills your array with random numbers between 0 and radius

for i=1:size(v1,2)

    v1(:,i)=[radius*rand,radius*rand];

end
% Cycle through the desired angles and draw the snowflake

for ang=0:60:300

    % This is the rotation matrix

    rot=[cosd(ang), -sind(ang); sind(ang), cosd(ang)];

    for i=1:2:size(v1,2)-1

        vtemp1=rot*v1(:,i); % Point 1

        vtemp2=rot*v1(:,i+1); % Point 2

        % Plot the line at a given angle

        m=plot([vtemp1(1),vtemp2(1)],[vtemp1(2),vtemp2(2)],'Color',[.5*rand+.4,.5*rand+.4,.9],'LineWidth',10);

        pause(0.01)

    end

end
Here are some examples of snowflakes generated with the above program!
Using other functions
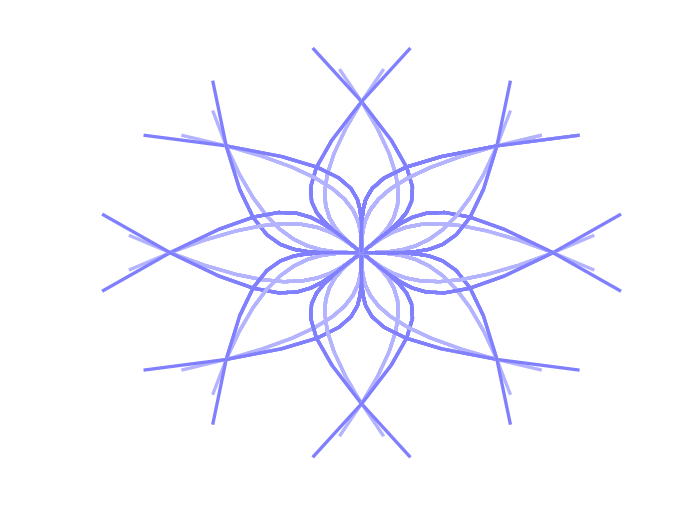
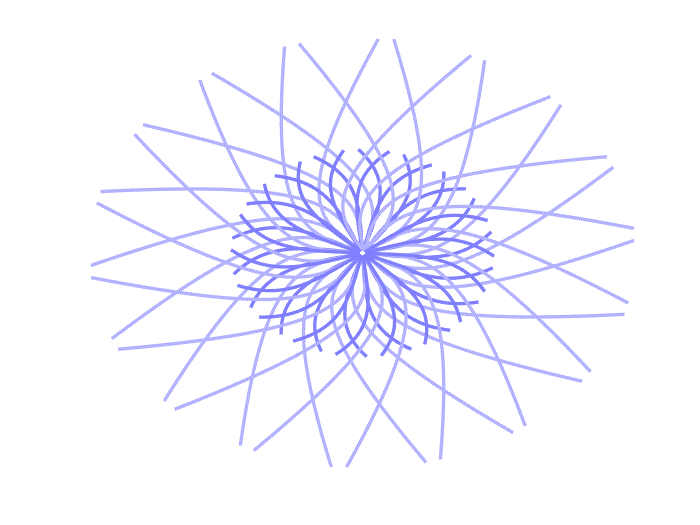
Of course, there's nothing that says we have to rotate only straight lines; let's try rotating other functions!
x=1:45;

x2=1:45;

y=exp(.1*x);

y2=-.2*exp(.1*x);

figure

for i=1:length(x)

    plot(x(1:i),y(1:i),'Color',[.7 .7 1],'LineWidth',2)

    plot(x2(1:i),y2(1:i),'Color',[.5 .5 1],'LineWidth',2)

    axis off

    xlim([-100,100]);

    ylim([-100,100]);

    hold on

    pause(0.01)

end

hold on
for ang=0:30:30*22

    rot=[cosd(ang), -sind(ang); sind(ang), cosd(ang)];

    for i=1:length(x)

        temp=[y(i);x(i)];

        temp2=rot*temp;

        x(i)=temp2(1);

        y(i)=temp2(2);

        temp=[y2(i);x2(i)];

        temp2=rot*temp;

        x2(i)=temp2(1);

        y2(i)=temp2(2);

        plot(x(1:i),y(1:i),'Color',[.7 .7 1],'LineWidth',2);

        plot(x2(1:i),y2(1:i),'Color',[.5 .5 1],'LineWidth',2);

        pause(0.001);

    end

end

x=1:45;

x2=1:45;
y=exp(.1*x);

y2=-.2*exp(.1*x);

figure

for i=1:length(x)

    plot(x(1:i),y(1:i),'Color',[.7 .7 1],'LineWidth',2)

    plot(x2(1:i),y2(1:i),'Color',[.5 .5 1],'LineWidth',2)

    axis off

    xlim([-100,100]);

    ylim([-100,100]);

    hold on

    pause(0.001)

end

hold on
for ang=0:20:20*40

    rot=[cosd(ang), -sind(ang); sind(ang), cosd(ang)];

    for i=1:length(x)

        temp=[y(i);x(i)];

        temp2=rot*temp;

        x(i)=temp2(1);

        y(i)=temp2(2);

        temp=[y2(i);x2(i)];

        temp2=rot*temp;

        x2(i)=temp2(1);

        y2(i)=temp2(2);

        plot(x(1:i),y(1:i),'Color',[.7 .7 1],'LineWidth',2);

        plot(x2(1:i),y2(1:i),'Color',[.5 .5 1],'LineWidth',2);

       pause(0.001);

    end

end
x=0:.1:1;

x2=0:.1:1;

y=x.^2;

y2=1./x;

figure
for ang=1:45:45*20

    rot=[cosd(ang), -sind(ang); sind(ang), cosd(ang)];

    for i=1:length(x)

        temp=[y(i);x(i)];

        temp2=rot*temp;

        x(i)=temp2(1);

        y(i)=temp2(2);

        temp=[y2(i);x2(i)];

        temp2=rot*temp;

        x2(i)=temp2(1);

        y2(i)=temp2(2);

        plot(x(1:i),y(1:i),'Color',[.7 .7 1],'LineWidth',2);

        axis off

        xlim([-2,2]);

        ylim([-2,2]);

        hold on

        plot(x2(1:i),y2(1:i),'Color',[.5 .5 1],'LineWidth',2);

        alpha(0.5)

        pause(0.001);

    end

end
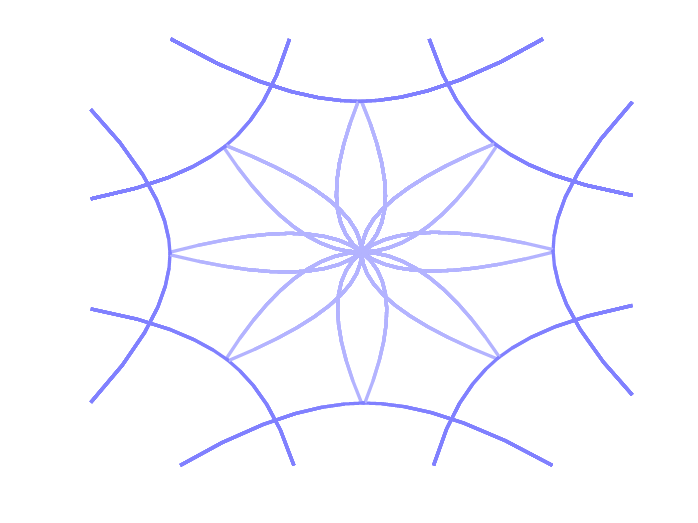
x=0:.1:1.1;

x2=0:.1:1.1;
y=x.^3;

y2=x.^5;

figure
for ang=0:45:45*16

    rot=[cosd(ang), -sind(ang); sind(ang), cosd(ang)];

    for i=1:length(x)

        temp=[y(i);x(i)];

        temp2=rot*temp;

        x(i)=temp2(1);

        y(i)=temp2(2);

        temp=[y2(i);x2(i)];

        temp2=rot*temp;

        x2(i)=temp2(1);

        y2(i)=temp2(2);

        plot(x(1:i),y(1:i),'Color',[.7 .7 1],'LineWidth',2);

        axis off

        xlim([-2,2]);

        ylim([-2,2]);

        hold on

        plot(x2(1:i),y2(1:i),'Color',[.5 .5 1],'LineWidth',2);

        pause(0.001);

    end

end