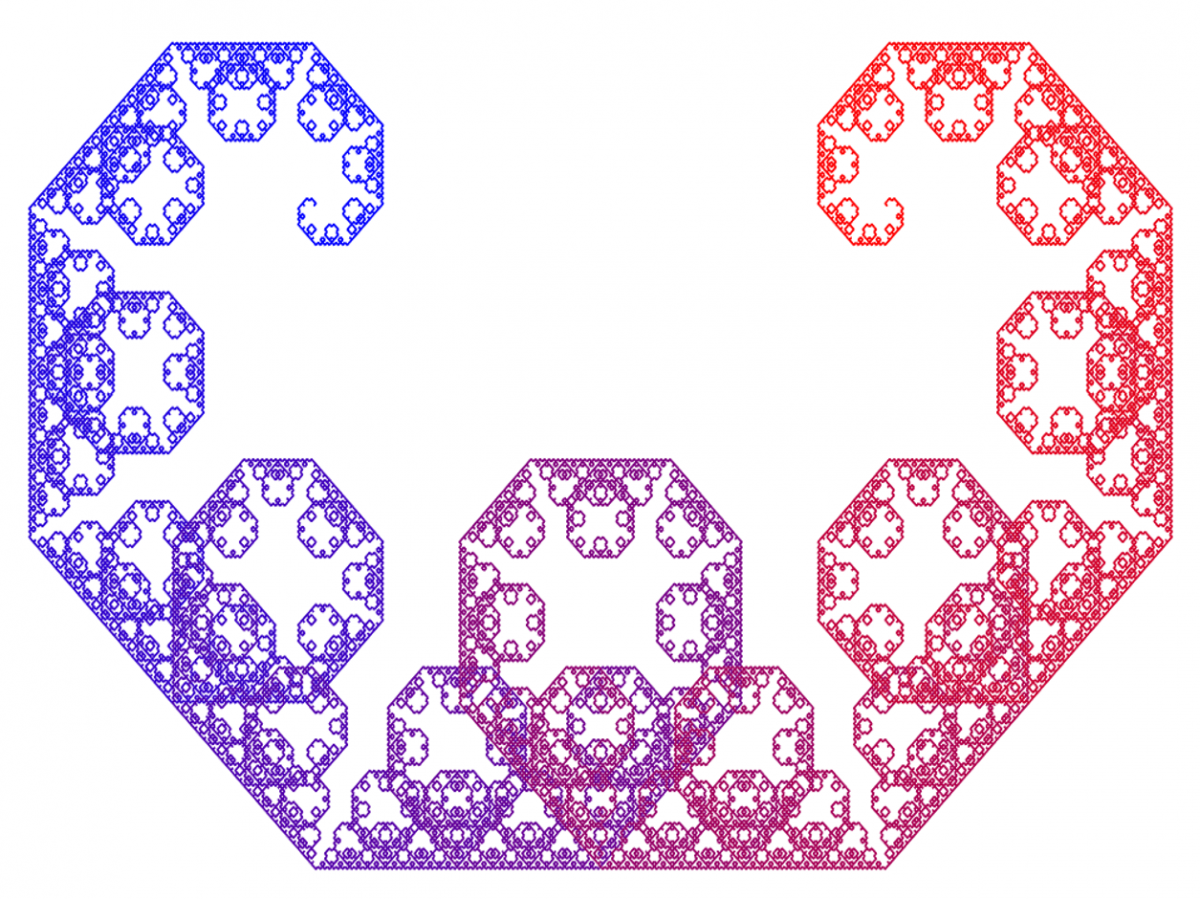
The Levy C Curve looks like this:
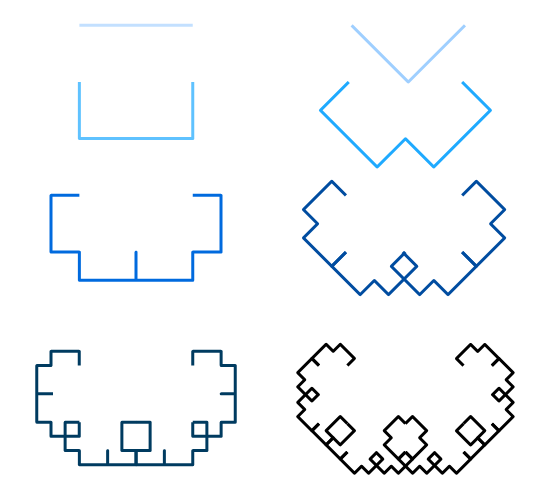
To generate it, you start with a line segment. This is the first stage. Then you replace the line segment with Two line segments, such that they form an isosceles triangle with the initial line, where the initial line is the hypotenuse. For stage three, you replace each of the two lines from stage two with two lines, again forming isosceles triangles with the stage two lines as the hypotenuses. You continue this pattern iteratively, and the form you create is termed the Levy C curve, named 'C' for the letter it resembles.
(preceding picture courtesy of wikipedia)
Here's a video showing the evolution of the Levy C curve through the first few stages.
Here's the code used to generate the figure:
function LevyC_Curve(iterations,angle)

% Draws a Levy C Curve for the given number of iterations
    pts=[0,0;1,0];

    length=1; % length of the hypotenuse


    % Initialize the figure and draw the first stage (a line)

    figure('Position',[50,50,1000,750],'Color',[1 1 1]);

    c=[0 0 1];

    plot([0 1],[0 0],'Color',c,'LineWidth',1)

    hold on

    xlim([-0.5,1.5]);

    ylim([-1,0.5]);

    axis off


    % Repeat for the given number of iterations

    for i=1:iterations


        % Clear the current figure

        cla

        % Calculate the length of the new line segments

        length=0.5*length/cosd(angle);

        % This will store all the points of the Levy C curve

        temp=[];


        % For each line segment, do the following

        for j=1:size(pts,1)-1


            % Grab the endpoints of the current line segment.

            pt1=pts(j,:);

            pt2=pts(j+1,:);


            % Subtract one endpoint from the other, so you're dealing with

            % rotations about the origin.

            pt2corr=pt2-pt1;


            % These lines determine the angle theta, which is calculated

            % slightly differently depending on which quadrant you end up

            % in.

            if 0>=pt2corr(1) && 0>=pt2corr(2)

                theta=atand(abs(pt2corr(2)/pt2corr(1)))+180;

            elseif 0>=pt2corr(1)

                theta=180-atand(abs(pt2corr(2)/pt2corr(1)));

            elseif 0>=pt2corr(2)

                theta=360-atand(abs(pt2corr(2)/pt2corr(1)));

            else

                theta=atand(abs(pt2corr(2)/pt2corr(1)));

            end


            % Calculate the 'midpoint' ; the vertex of the triangle

            midpt=[length*cosd(theta-angle)+pt1(1),length*sind(theta-angle)+pt1(2)];

            c=[j/size(pts,1) 0 1-j/size(pts,1)];


            % Plot the current lines

            plot([pt1(1),midpt(1),pt2(1)],[pt1(2),midpt(2),pt2(2)],'Color',c,'LineWidth',1)

            hold on

            xlim([-0.5,1.5]);

            ylim([-1,0.5]);

            axis off


            % Add the first endpoint and midpoint to the list of points

            temp=[temp;pt1;midpt];


        end


        % Append the final point to the list of points

        temp=[temp;pts(end,:)];

        % Briefly pause to view the current iteration

        pause(1)

        % Store the previous iteration's points in the pts variable

        pts=temp;

    end

end
Adding some variation:
The Levy C curve can be tiled in some very interesting ways.
Triangular Form:
What if instead of starting with a line, we started with a triangle?
Triangular Form (inwards):
What if, instead of the iteration going outwards from the triangle, they went inwards?
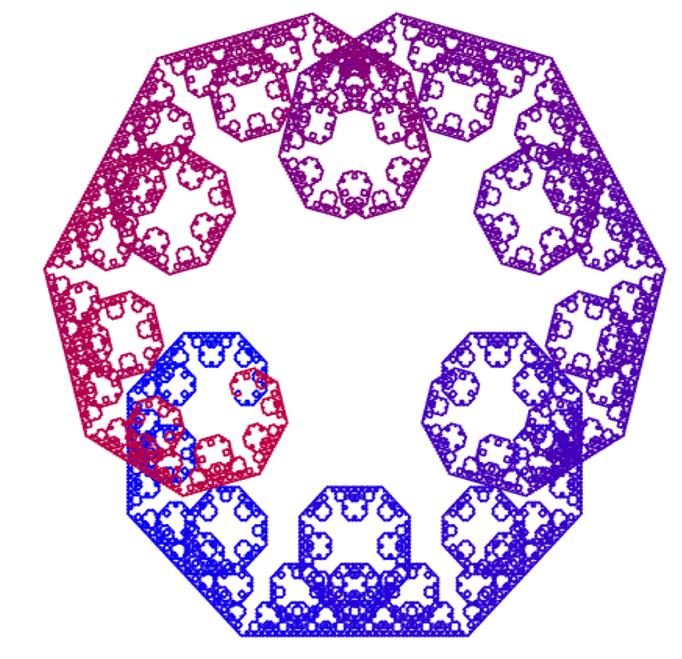
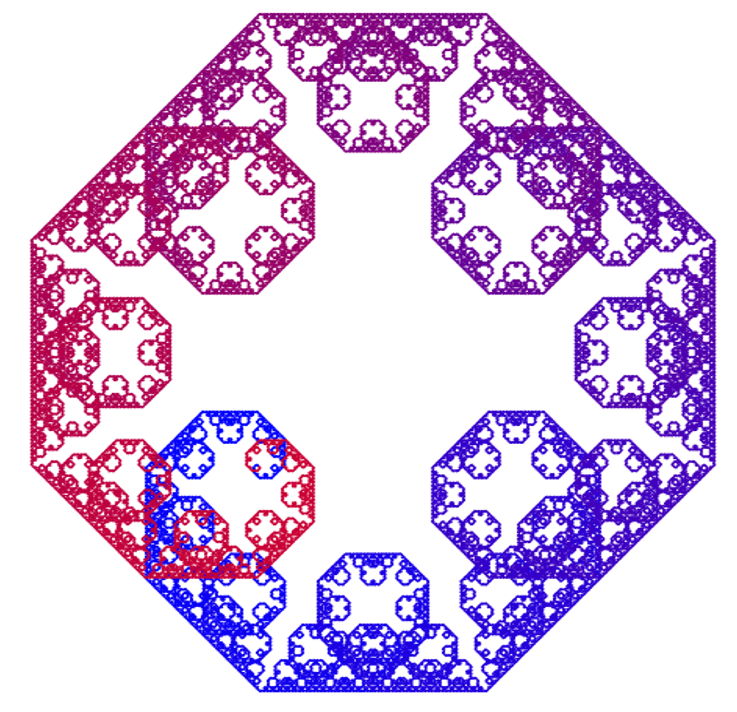
Square form:
What if we started with a square?
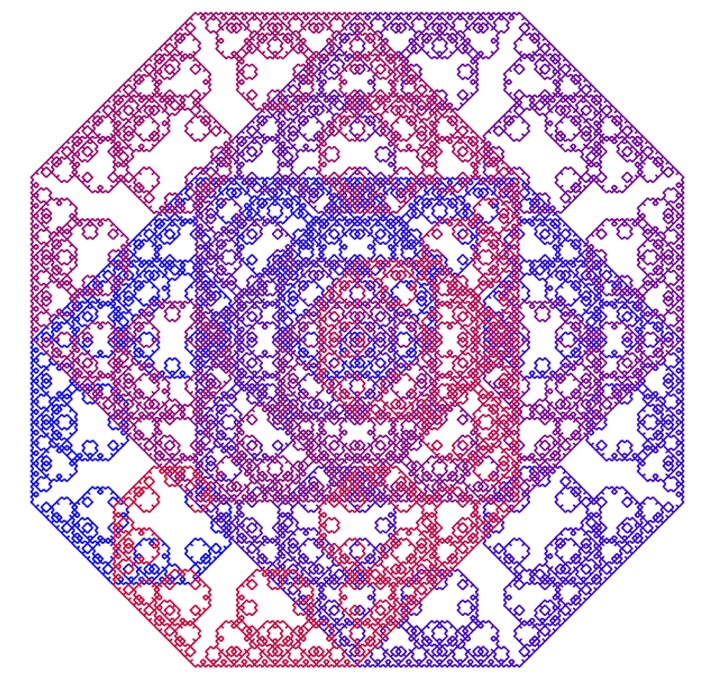
Square form (separated):
What if we started with a square, but separated out the sides?

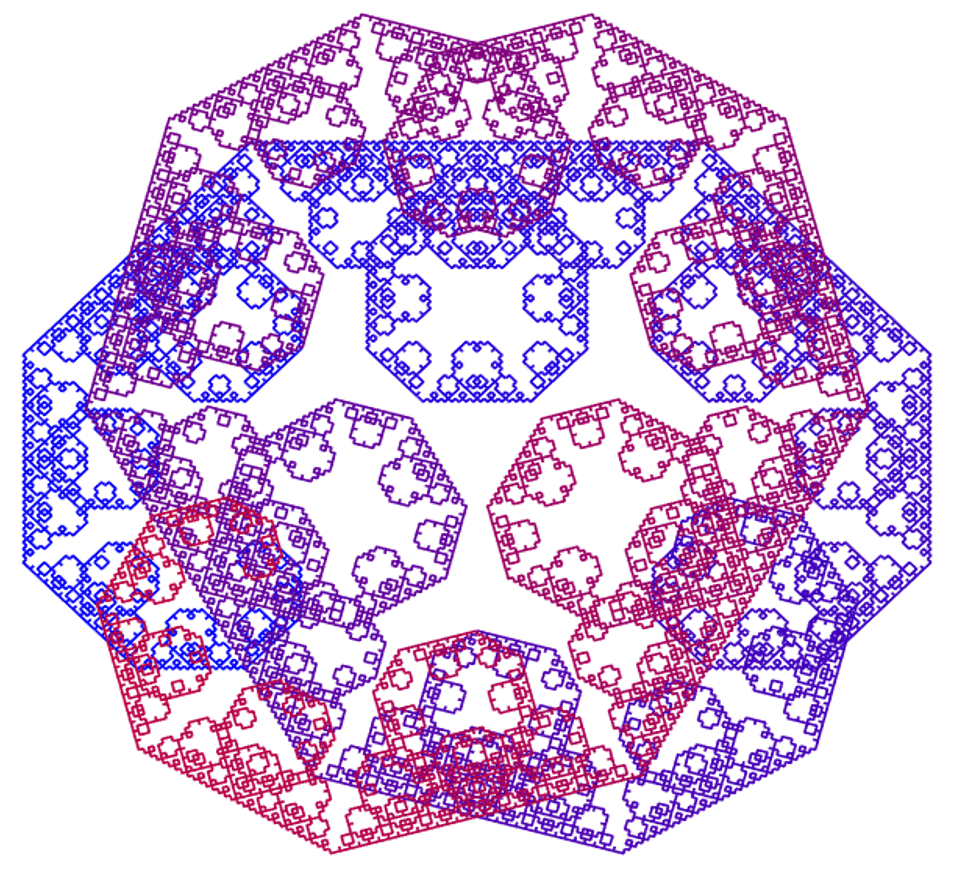
Square Form (inwards):
What if we started with a square, but had the angles propagate inwards? This is a common form of the Levy C curve, and is commonly called a carpet.
Code
All of these (except the separated square one) can be made using the following Matlab function:
function LevyC_Curve_General(iterations,angle,inverted,makeVideo,shape)

% Generates a Levy C curve that startes from a triangle, with inputs:

%   iterations = int; total number of iterations

%   angle = number; angle at which the Levy C curve is computed

%   inverted = 1 or 0; set to 1 to invert the angles (so they go inward)

%   makeVideo = 1 or 0; set to 1 to make a video

%   shape = 1, 2, or 3; 1 = line; 2 = triangle; 3 = square
    % If making a video, set up the video object

    if makeVideo==1

        writerObj = VideoWriter('levyC_squareVideoNew1'); % Name it.

        writerObj.FrameRate = 1;

        writerObj.Quality=100;

        open(writerObj)

    end
    length=1;


    % Initialize the figure

    figure('Position',[50,50,700, 700],'Color',[1 1 1]);

    c=[0 0 1];


    % Set the initial points for whichever shape you are drawing and plot

    % them. Also set the x and y limits for the graph.


    % Starting with a LINE

    if shape==1

        pts=[0,0;1,0];

        plot([0 1],[0 0],'Color',c,'LineWidth',1)

        xlimValues=[-.5,1.5];

        ylimValues=[-1,0.5];


    % Starting with a TRIANGLE

    elseif shape==2

        pt3=[cosd(120) -sind(120); sind(120) cosd(120)]*[1;0]+[0.5;0];

        pts=[-0.5,0;0.5,0;pt3'];

        plot([pts(1,1) pts(2,1) pts(3,1) pts(1,1)],[pts(1,2) pts(2,2) pts(3,2) pts(1,2)],'Color',c,'LineWidth',1)

        if inverted==1

            xlimValues=[-1,1];

            ylimValues=[-.75,1.25];

        else

            xlimValues=[-1.5,1.5];

            ylimValues=[-1.25,2.25];

        end


    % Starting with a SQUARE

    elseif shape==3

        pts=[-0.5,-0.5;0.5,-0.5;0.5,0.5;-0.5,0.5];

        plot([pts(1,1) pts(2,1) pts(3,1) pts(4,1) pts(1,1)],[pts(1,2) pts(2,2) pts(3,2) pts(4,2) pts(1,2)],'Color',c,'LineWidth',1)

        if inverted==1

            xlimValues=[-1.5,1.5];

            ylimValues=[-1.5,1.5];

        else

            xlimValues=[-2,2];

            ylimValues=[-2,2];

        end

    end

    hold on

    xlim(xlimValues);

    ylim(ylimValues);

    axis off

    pause(1)


    % Grab a frame for the video, if making a video

    if makeVideo==1

        frame = getframe(1);

        writeVideo(writerObj, frame)

    end


    % Repeat for the given number of iterations

    for i=1:iterations

        length=0.5*length/cosd(angle);


        % Clear the current axes

        cla


        % This will store the point values for the current iteration

        temp=[];


        % Repeat for each line segment

        for j=1:size(pts,1)


            % Grab the two endpoints of the current line segment

            pt1=pts(j,:);

            if j==size(pts,1)

                pt2=pts(1,:);

            else

                pt2=pts(j+1,:);

            end


            % Subtract the two points so you are centered at zero. Then

            % determine the current angle

            pt2corr=pt2-pt1;

            if 0>=pt2corr(1) && 0>=pt2corr(2)

                theta=atand(abs(pt2corr(2)/pt2corr(1)))+180;

            elseif 0>=pt2corr(1)

                theta=180-atand(abs(pt2corr(2)/pt2corr(1)));

            elseif 0>=pt2corr(2)

                theta=360-atand(abs(pt2corr(2)/pt2corr(1)));

            else

                theta=atand(abs(pt2corr(2)/pt2corr(1)));

            end


            % Calculate the 'midpoint'; the top of the triangle drawn with

            % the current line segment as the base

            if inverted==1

                midpt=[length*cosd(theta+angle)+pt1(1),...

                    length*sind(theta+angle)+pt1(2)];

            else

                midpt=[length*cosd(theta-angle)+pt1(1),...

                    length*sind(theta-angle)+pt1(2)];

            end


            % Determine the line color based on the iteration

            c=[j/size(pts,1) 0 1-j/size(pts,1)];


            % Plot the new line segments

            plot([pt1(1) midpt(1) pt2(1)],[pt1(2) midpt(2) pt2(2)],...

                'Color',c,'LineWidth',1)

            hold on

            xlim(xlimValues);

            ylim(ylimValues);

            axis off

            temp=[temp;pt1;midpt];

        end

        temp=[temp;pt2];


        % Store the points from the previous iteration in the pts variable

        pts=temp;


        % After plotting all the line segments in a given iteration, pause

        % to view the figure. And grab a frame if making a video.

        pause(1)

        if makeVideo==1

            frame = getframe(1);

            writeVideo(writerObj, frame)

        end

    end


    % If you're making a video, add a couple of frames of the final image

    if makeVideo==1

        for i=5

            frame = getframe(1);

            writeVideo(writerObj, frame)

        end

        close(writerObj)

    end

end